For certain remote-sensing applications, such as monitoring environmental change, it is essential to be able to compare classes from image to image. In spite of successes in classifying some individual multispectral images using conventional supervised or unsupervised techniques, it has been difficult to obtain consistent classes from images taken at different times, owing to variability in illumination, atmospheric effects and instrumental response. As a result, with a few exceptions (e.g., Hall et al., 1991, and Lucas et al., 1993), monitoring of changes in land cover by remote sensing typically has been restricted to measurements of changes in spatial patterns, and less attention has been given to spectral changes.
Long-term monitoring of changes in vegetation cover in the Amazon Basin has been focused primarily on the removal of forest cover, rather than on more subtle changes in land use or vegetation cover. Brazil's space agency, Instituto Nacional de Pesquisas Espaciais (INPE), has acquired Landsat data through its own receiving station since 1975, and, despite frequent cloud cover in the Amazon region, these images comprise a rich historical record of deforestation and land use in Amazonia. INPE monitors deforestation by analyzing Landsat Thematic Mapper (TM) color composites of bands 3, 4 and 5 (e.g., INPE, 1992). Skole and Tucker (1993) compiled a large-area mosaic of Landsat TM band 5 images to assess deforestation and habitat fragmentation in the Brazilian Amazon between 1978 and 1988.
There has been little work on regrowth or land-use changes within the cleared areas in Amazonia, although such information is vital to assessments of biomass and carbon cycling. Lucas et al. (1993) addressed this problem in a study of the same area north of Manaus that was studied in this paper. They applied a minimum-distance classifier to four time-series TM images using bands 3, 4 and 5 to define three broad categories of land cover for each date: primary forest, secondary forest and agricultural land. Changes in land cover in the TM images and in two older MSS images were used to estimate the ages of secondary forests. The study by Lucas et al. (1993) illustrates both the importance of using time-series Landsat (or other multispectral) data, and the limitations inherent in applying traditional statistically based spectral classifiers to such images.
In our study we tested a fundamentally different way of classifying multispectral (and hyperspectral) images based on spectral mixture analysis (SMA) (e.g., Adams et al., 1986, 1993a; Smith et al., 1990a, b; Gillespie et al., 1990). Encoded-radiances (DN's) in all bands were transformed to fractions of reference endmembers, which are reflectance spectra of well characterized materials that mix to produce spectra equivalent to those of pixels of interest in an image. Endmember fractions are easier to interpret than DN's, and, therefore, provide a more intuitive link between image measurements and observations in the field. For example, field observers readily understand the significance of a pixel having 65% green vegetation and 35% soil, but have more difficulty interpreting the equivalent band-radiance values. Classes were defined as domains of fractions of endmembers; thus, classes were defined in a physical context, such as the amount of green vegetation, rather than on statistically defined clusters of data points.
The SMA-based classification was tested on a time series of Landsat TM images in the context of an on-going multi-disciplinary study of hydrology and land-use change in the Brazilian Amazon. The joint Brazilian-U.S. project is part of NASA's Earth Observing System (EOS) program. One aspect of the study is to measure long-term environmental changes, including natural processes (Batista et al., 1993; Nelson et al., 1994; Nelson, 1994), and anthropogenic activities of deforestation, agriculture and urbanization (e.g., INPE, 1992; Skole and Tucker, 1993; Shimabukuro et al., 1994; Fearnside, 1993 and references cited therein).
Adams et al. (1990) compared calibrated TM images for August 1988 and
August 1989 of the area north of Manaus, and demonstrated that the primary
forest and different communities of regrowth vegetation could be described by
variations in the fractions of spectral endmembers: green vegetation (GV),
non-photosynthetic vegetation (NPV; e.g., bark) and shade. Additional
categories of land use were discriminated when soil was included in the
analysis. Adams et al. (1990) also showed that temporal changes on the land
surface (as documented by field observations) were accompanied by variations in
the fractions of the endmembers. The present study extended this analysis to
two additional images of the same area (August 1990 and August 1991) and
developed the SMA-based classification of the four-image time series. The
results of spectral classification of this time series are presented to
illustrate the methodology and to show details of land-use change. The
ecological and hydrological implications of land-use change in this area will
be published separately, as will a more complete record of deforestation and
land use since the mid 1970's.
Field Observations and Measurements
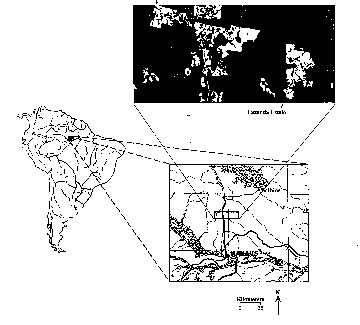
The area north of Manaus (Fig. 1) is still dominated by primary forest, but clearing for cultivation and pasture has occurred locally since the late 1970's, especially along the main road (BR 174) leading north to Boa Vista. Field observations were made by one or more of the authors within one to four weeks of the time of acquisition of each of the TM images (August 1988, 1989, 1990, 1991). They were concentrated at two cattle ranches, Fazenda Dimona and Fazenda Esteio, which are ca. 70 km north of Manaus along the BR 174 (Fig. 1), and include research areas of the Biological Dynamics of Forest Fragments Project (BDFFP) of the National Institute for Research in Amazonia (INPA) and the Smithsonian Institution (Lovejoy and Bierregaard, 1990; Bierregaard et al., 1992). Because of their uneven management histories (Bierregaard et al., 1992), these ranches include a wide range of vegetation from well maintained pasture through regrowth to primary forest (Lucas et al., 1993). The rectilinear layout of the ranches and the small, regular forest fragments of the BDFFP facilitated location and orientation on the images and in the field.
Each year both sites were photographed on the ground and from light
aircraft, and additional air observations and photographs were made of much of
the area extending northwards between Manaus and the Balbina reservoir.
Reflectance spectra from 400 nm to 1000 nm were obtained for materials in the
field using Spectron Engineering and Analytical Spectral Devices hand-held
spectroradiometers. Spectral and photographic measurements of primary forest
canopy were made at two 40 m research towers operated by INPA, one at Reserva
Ducke and one at Bacia Modelo. Samples of soils and dry vegetation were
collected and measured in the laboratory at the University of Washington over
the wavelength range 400 nm to 2500 nm using a modified Beckman
total-hemispherical spectroreflectometer.
Image Calibration
Time-of-flight system and atmospheric calibration data were not available for Landsat images of the study area. Nor was it possible to calibrate empirically to ground targets at the time of each overpass of the satellite. A nominal calibration to reflectance using pre-flight instrument calibration data and a standard atmospheric model was not made, because the accuracy of these corrections could not have been verified, and any errors in calibration might have propagated undetected into the classification (Sabol et al., 1992a,b; Smith et al., 1994a, b).
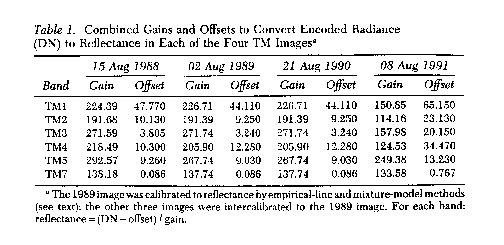
The 1989 image was calibrated using a modified empirical-line method (Roberts et al., 1993) and by the spectral mixture analysis method (Smith et al., 1990a; Gillespie et al., 1990; Adams, 1993b). The other three images were inter calibrated to the 1989 image using training areas known to be temporally invariant. The inter calibration of these images used by Hall et al. (1991) where they applied a "radiometric rectification" towas similar to the approach allow a comparison of classes from two Landsat images taken at different times. However, the Hall et al. (1991) supervised classification did not require an absolute calibration to reflectance. In the present study it was essential to calibrate to reflectance to permit the images to be analyzed within the framework of reference endmembers consisting of laboratory and field reflectance spectra.
Table 1 gives the gain and offset that was applied to each band of the four images to convert DN to reflectance. Each gain and each offset combines multiple effects, including those contributed by the instrument and atmosphere. Calibrations were applied uniformly to each image, and did not take into account variability in the atmosphere across individual images.
A major source of spectral variability from one image to another in a time series is illumination differences associated with variations in solar elevation and azimuth and local incidence angle. Although variations in illumination within each image that are caused by macro-topography can be removed if a satisfactory photometric function is combined with digital terrain-elevation models, suitable topographic data were not available for the area studied. The effects of illumination differences were minimized by comparing images of the same area that were all acquired in August of successive years. Furthermore, the topographic relief in the study area is low, although there is shadowing along ravines, and associated with vegetation canopies.
Illumination variations caused by topography and roughness at all scales
(including sub-pixel "texture") were incorporated into the endmember "shade" in
a spectral mixture analysis, discussed below. Shade was used as one basis for
classification, as will be discussed; however, shade also was removed from the
images by rescaling the fractions of the endmembers after deleting the shade.
Endmembers, Fractions and Residuals
Mixed pixels and the concept of endmember proportions were recognized in early studies of multispectral images (e.g., Horowitz et al. 1971). Subsequently, several approaches to unmixing multispectral images have been explored, and there is a rapidly growing literature. (See, for example, references cited in Adams et al., 1993a.) Most studies of unmixing have used uncalibrated spectra derived from training areas on images (image endmembers). When relatively pure, image endmembers may model mixed pixels within one image; however, uncalibrated, image-derived endmembers also may change from image to image in a time series. To monitor spectral changes over time it is essential to delineate invariant laboratory or field reflectance spectra (reference endmembers).
Spectral mixture analysis differs from many other applications of linear mixing to multispectral images in that it links image spectra to laboratory reflectance spectra of materials that comprise most reference data sets. Thus, as used in this paper, SMA is an analytical framework within which images are calibrated to reflectance, and pixels are modeled as potential mixtures of selected laboratory or field spectra. All endmember spectra may mix with shade, to simulate spectral variations in illumination caused by topography and surface texture. This evolving technique has been applied in various contexts (e.g., Adams et al., 1986, 1989, 1993a; ; Smith et al., 1990a, b, 1994a, b; Gillespie et al., 1990; Roberts et al., 1993).
In our study image endmembers were selected as a first step; then reference endmembers were found, along with combined gains and offsets for each band to calibrate the image to reflectance. Image endmembers were chosen either from training areas on the image or by step-wise analysis of each pixel. All six reflective bands were used. Image endmembers consisted of spectra (in DN) which, when mixed, produced spectra that fit many other pixels in the image. Image endmembers represented spectral extremes in the image, but only those that participated in mixing. Thus, for example, the spectrum of a body of water is distinct and "pure" (not a mixture), but it was not a useful endmember for the rest of the image, because pixels containing water occurred only locally. DN's for each pixel were converted to fractions of image endmembers using equation (1) and solving the pseudo-inverse matrix (Golub and Van Loan, 1989). Fractions of endmembers summed to 1 for each pixel.
and (1)
DNi = encoded radiance in band i for each pixel
DNik = encoded radiance in band i for each image endmember, k
fik = fraction of each image endmember, k, calculated band by band
i = band number
k = each of n image endmembers
= remainder between measured and modeled DN ("band residual")
Image endmembers themselves were re-defined as mixtures of reference endmembers which were derived from a set of laboratory or field spectra measured in units of reflectance. Reference endmembers were selected from spectra of materials occurring in the study area, and from other relevant spectra. For example, spectra of forested areas typically could be fit by mixtures of laboratory or field spectra (reference spectra) of green vegetation, non-photosynthetic vegetation and shade. Image endmembers were described in terms of reference endmembers by:
and (2)
DNik = encoded radiance in band i for each image endmember k
fijk = fraction of each reference endmember j that contributes to k,
calculated band by band
Rij = reflectance in band i for each reference endmember j
i = remainder between measured and modeled DN
g'i = gain for band i
o'i = offset for band i
Image endmembers were calibrated to reflectance using equation (2) by calculating the combined gains and offsets for each band. The values found for the gains and offsets are given in Table 1, and can be used to calibrate all pixels to reflectance, assuming a spatially uniform atmosphere. In the rest of this paper the term "endmember" means "reference endmember."
In addition to fractions of the endmembers, band residuals were calculated for each pixel. The band residual is the difference between the measured and the modeled DN in each band. Residuals over all bands were summarized as a root-mean-squared (RMS) "error." The overall fit of the model was judged to be "good" if: 1) band residuals and/or RMS error were low, and 2) fractions were not <0 or >1. Pixels having high RMS values and/or fractions <0 or >1 indicated unmodeled compositional variability in the scene. The simple endmember model applied here was not expected to fit all pixels. The physical significance of fraction and RMS departures from the simple model was evaluated within a spatial context by displaying fractions, RMS-error values and (in a few cases) band residuals as images. Such images could have been used to guide further analysis by applying multiple sets of endmembers (Sabol et al., 1992b, Roberts et al., 1992, and Adams et al., 1993a), or foreground / background analysis (Smith et al. 1994a, b). However, the added compositional information that would have been gained from these techniques was not needed to produce the basic classification discussed in this paper.
Systematic errors occurred in estimates of the fraction of green
vegetation when the linear mixing model was applied. Non-linear mixing effects,
largely introduced by transmission of light through green leaves at near
infrared wavelengths, are well documented (e.g. Roberts et al. 1990, 1993), but
were judged to be small enough to ignore for the purposes of the simple model
applied here.
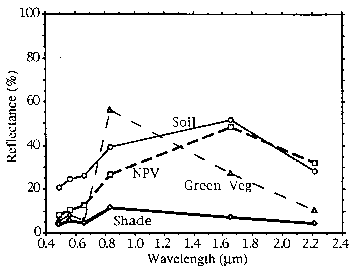
Number and Variability of Endmembers The same four (reference) endmembers, shade, green vegetation (GV), non-photosynthetic vegetation (NPV) and soil (Fig. 2) were used to model all of the images used in this study. It was recognized that four spectra were inadequate to describe the full range of natural variability of materials on the ground. The selected endmembers were proxies for three broad kinds of spectrally distinct materials (plus shade). It is not appropriate to interpret them in a more specific context, for example as a vegetation species. Shade included light scattered and/or transmitted by green vegetation (Roberts et al., 1993), and was not simply a photometric shade having zero reflectance in all bands.
Endmembers were selected from a computer library of spectra by applying equation (2). It is possible that other spectra not included in our collection might provide an equally good or better fit to the images. Variations in the endmember spectra affected estimates of fractions; however, classification results were relatively insensitive to small variations in the endmembers. An important function of the selected endmembers was to provide a consistent frame of reference for analysis of the four images.
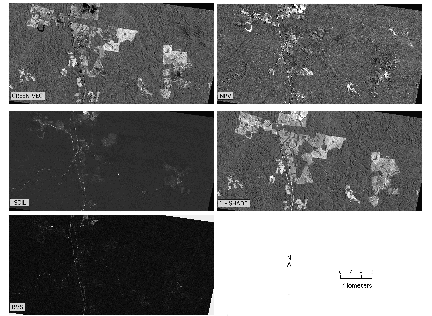
The fraction images and the RMS-residual images show that the closed-canopy vegetated areas that dominate the study area were well modeled by the basic endmembers GV, NPV and shade (Fig. 3). In these areas where no soil was exposed, the band-residual images revealed spectral variability in the vegetation itself; however this variability was near the level of system noise, as expressed by banding and speckle. Field observations confirmed that the main differences among vegetation communities were the variable fractions of the endmembers. For example, the primary forest was characterized by relatively high fractions of shade and NPV.
Shade was an important parameter for distinguishing different vegetation types. The primary forest had the highest shade fraction because canopy roughness produces self shadowing. Second-growth vegetation dominated by Cecropia and Vismia was characterized by smoother canopies, and had a lower shade fraction. Areas that were clear of vegetation, or that were covered by Kudzu vine, had the lowest amount of shade. The topographic effects of shade are visually apparent (Fig. 3).
When relative fractions of the endmembers for each TM date were compared with field and aircraft observations, pixel-to-pixel variability in the endmembers was consistent with qualitative and semi-quantitative field data. Quantitative measurements of the fractions proved to be impractical. For example, the felling of trees and shrubs produced a ground cover dominated by woody material in trunks and branches, and dead or dying leaves. The exposure of these materials (here termed "slash"), along with litter and some soil, was accompanied by an obvious decrease in the fractions of GV and shade, and an increase in NPV and soil. Although the absolute fractions, in principle, could have been measured by line transects or quadrats, in fact it was not feasible to make such measurements for several pixel-sized areas (30m x 30m) over a tangled mass of downed trees and branches. Primary forest presented a similar problem, in that the fraction of NPV includes trunks, branches and stems over a wide range of spatial scales in a rough and largely inaccessible canopy. NPV and green vegetation were estimated from observations and photographs of forest canopy from a 40-m tower, and from many low-altitude color aerial photographs; however, quantitative measurements at all scales, especially over an area of several pixels, were impractical within the scope of the field program.
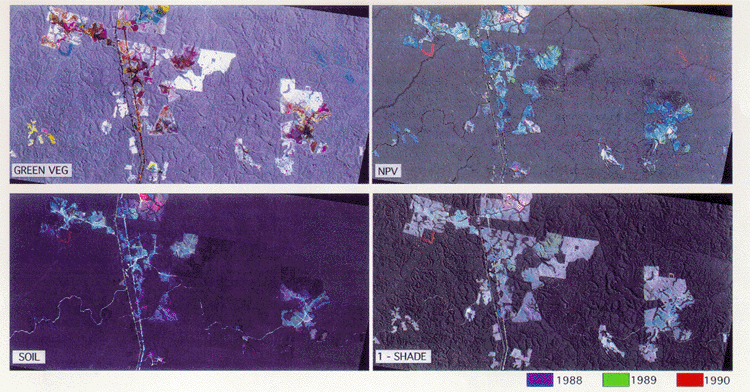
Temporal Variations in Endmember Fractions The 1988, 1989, 1990 and 1991 TM images were co-registered and the fractions of each endmember were compared among years. Qualitative changes in the fractions were displayed as color composites, using three images at a time (Fig. 4 and Table 2). In three-year color composite images major changes in fractions have the most saturated colors, whereas minor changes produced less saturated colors, and gray tones indicate no temporal change.
Interpretation (Table 2) was based on an experiential assessment of changes in the individual endmembers. For example, in the NPV image (Fig. 4), red signifies a large increase in the fraction of NPV in 1990 relative to the previous two years. Field experience indicated that cutting of vegetation was the most common way that NPV was increased by a large amount inside and bordering the previously cleared areas. This interpretation was tested by examining the other endmembers. Support for the interpretation of cut vegetation was found when the same pixels that showed a large increase in NPV in 1990 also showed a large decrease in GV and in shade, and a small increase in soil. Each of these relative changes was consistent with cutting of vegetation. Other interpretations were derived similarly from the basic data shown in Fig. 4 and Table 2. Fine details of clearing and regrowth of vegetation are shown in the color composites. Locally, many of these changes were confirmed by field and aircraft observations.
Color composites revealed subtle relative changes in the proportions of the endmembers; however, it was difficult to quickly render a visual interpretation of all of the colors on these images without using a key. Furthermore, color composites are limited to three images. To show changes over more than three images it is necessary to establish a classification.
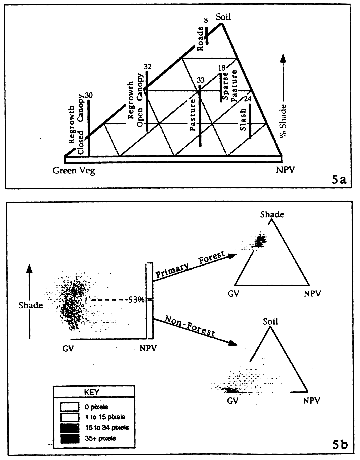
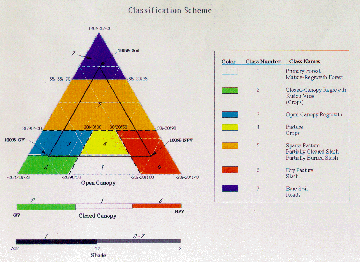
Classification The first step in the classification procedure was to define areas on the images that corresponded to known types of land cover, based on field observations. Mean values of the fractions of the four endmembers were measured for representative areas on the images. Mean values for several types of land cover are plotted in Fig. 5a. They are representative of, but do not define the limits of, the prospective classes. Class names were selected to have significance to an observer in the field in the context of this study (Adams et al., 1989, 1990, 1993a).
The second step in the classification was to define the limits of each class. Fractions of the four endmembers for each pixel were displayed as a data cluster on a modified tetrahedron (Fig. 5b) that could be rotated on the computer screen to show any desired projection. Class boundaries in the data space were established by an interactive process of color-highlighting on projections of the data cluster, on histograms of the individual endmembers, and on the images. Data points highlighted on any one representation of the data were simultaneously displayed on the others (Buja et al., 1987, 1991). Although only the 1990 sub-scene was used in Fig. 5 all TM images were used to establish class boundaries, because the best example of classes sometimes occurred in different images. This empirical method assured that all well understood areas on the image were correctly located in the data cluster.
A satisfactory segmentation of the data cluster and the image required that boundaries be established sequentially, and in a particular order. First, the data were divided into two categories based on the shade fraction. In the August images studied, a fraction of 0.53 (hereafter referred to as 53%) shade separated primary forest from other types of land cover, the primary forest having the higher shade fraction. A subsequent step subdivided the <53%-shade pixels having no soil into levels of NPV relative to GV. The remaining <53%-shade pixels were then categorized based on GV, NPV and soil fractions. Sub-classes of forest are not discussed in this paper.
Because the shade fraction varies with sun elevation and azimuth, shade cannot be included as a field attribute when classifying land cover. Non-forest pixels were categorized after removing shade by re-summing to 1 the fractions of GV, NPV and soil (Figs. 5 and 6). Normalization "removes" shade by apportioning the shade fraction to the other endmembers. Although normalization removes shading well, it is only an approximation in the case of shadows (Adams et al., 1993a). Classes that were defined by normalized fractions were minimally influenced by illumination and topography, making it possible, in principle, to define the same classes in any image, regardless of illumination conditions.
By defining classes in terms of fractions of endmembers it was possible to predict where most types of land cover would occur in the data space (Figs. 5 and 6). Predictions were checked using known training areas, and were consistently correct as long as the field area could be described in terms of the abundances of the four endmembers. Thus it was possible to classify types of land cover for which there were no known training areas. For example, during early analysis of the 1988 image there was no field-verified example of a forested area that had just been cut, and had not been burned, that would provide a training area for the class "Slash." It was evident, however, that Slash should have a very low fraction of GV, a high fraction of NPV (bark, wood and dry leaves) and a low fraction of soil. Thus, an estimate was made as to where the class Slash would occur on Figs. 5 and 6. This prediction was proved correct when a good example of Slash appeared on the 1990 image, and its identity was verified in the field.
Nomenclature and Spectral Mimicking The nomenclature for the classes (Table 3) represents a level of abstraction beyond that of the endmembers. Because each class name was selected to have significance to an observer in the field, each carries strong spatial implications that dominate the spectral ones. For example, few observers have a mental image of a TM spectrum of a forest, whereas most know what a forest looks like in the field. To judge whether a pixel was correctly classified spectrally required that the spectral and spatial information be reconciled.
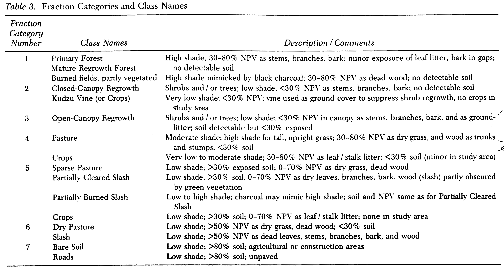
There is no a priori reason why class names that are based on field (spatial) observations should have unique fractions of endmembers, anymore than they should have unique combinations of DN values. Endmember fractions, therefore, cannot always be inverted to unique class names. Nevertheless, in the Amazon context, the endmember fractions for each pixel corresponded to a small number of possible classes, as is shown in Table 3. Additional information was needed to decide among the possible choices of classes, as is discussed below.
To avoid premature selection of specific class names, all classes that mimicked one another were grouped and labeled by numbered category (Fig. 6). For example, based on the four endmembers, which included only one type of NPV, it was not possible to distinguish between the classes Slash and Dry Pasture; therefore a numbered category was established that included both. In this example the ambiguity could be resolved in several ways: 1) by introducing additional endmembers for NPV that distinguished between dry grass and bark / wood / dry leaves (see Methods Section); 2) by historical context; for example, if the pixel were known to have been Primary Forest shortly before changing to Slash or Dry Pasture, it would more likely be Slash; 3) by outside information and / or field context.
Temporal Changes in Classes Changes on the ground from one year to another were accompanied by predictable changes in the representative fractions of the endmembers, as was shown in the color composite images (Fig. 4). Changes occurred either as a "jump" from one set of representative fractions to another, such as from Primary Forest to Slash, or as a partial shift of the fractions resulting in a small translation within the data tetrahedron (Figs. 5 and 6). Classification changes were recorded whenever fraction values crossed class boundaries.
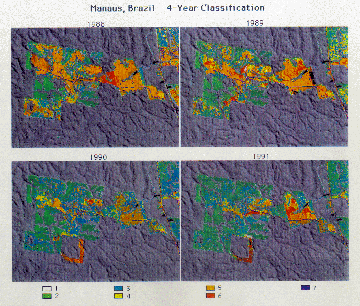
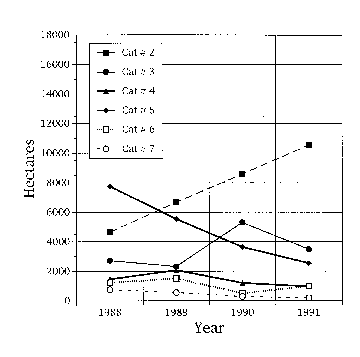
Class changes for Fazenda Dimona are shown in Fig. 7. From visual comparison alone it is evident that over the three-year period from August 1988 to August 1991 there were significant changes in the amount of cleared land relative to the area covered by second-growth vegetation. The data were used to make quantitative assessments of changes in individual classes, and in groups of classes (Fig. 8). Interpretation of the changes in land cover is deferred to a separate paper.
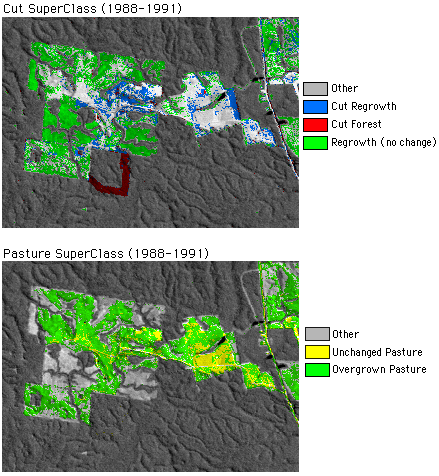
Pixel Histories and Super Classes Using the co-registered, classified images for the four years, temporal changes were recorded for each pixel, to establish historical records. Changes in class assignments implied that specific processes had affected the land cover. For example, a change from Pasture to Open-Canopy Regrowth implied growth of shrubs, and an attendant lack of maintenance of the pasture. Most pixels could be classified at a higher level on the basis of their history, as was done by Adams et al. (1990) using just the 1988 and 1989 images. Thus, a pixel that had the class history (in these images) of Primary Forest--->Slash--->Pasture, could be assigned a new class name such as "forest converted to pasture." Another pixel might have the history: Pasture--->Open-Canopy Regrowth--->Closed-Canopy Regrowth, and could carry a new class name such as "overgrown pasture." Higher-level classes were termed "super classes." Formal names were not given to super classes, because there are many possible pixel histories over the elapsed three-year period, and the utility of any super class depends on the local context and on the objectives of the study. Super classes were displayed by assigning distinctive colors to pixels having similar class histories, and superposing the color information on a reference image, such as a shade-complement image (Fig. 9).
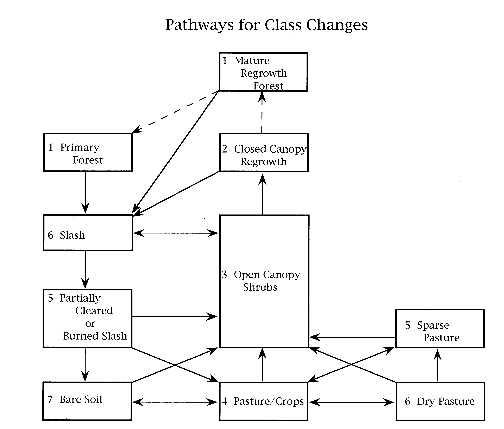
Class changes (Fig. 10) could occur between two, three and four images (one, two and three time-intervals, respectively). Because class changes have specific implications regarding processes on the ground they must be interpreted in context with field and other evidence, and the time associated with each process must be considered. For example, three years are not enough to measure a change from pasture to primary forest; however, many other changes were found to occur over a period of one year, including transitions from cleared areas to closed-canopy regrowth. Thus, even the images spaced at one-year intervals do not necessarily record all of the class changes that are associated with surface processes. Unrecorded classes may be implied from the recorded class changes. If the recorded class change is from forest to closed-canopy shrubs, there may even have been multiple cycles of clearing and regrowth that occurred between images. Although this history is not recorded, there is a minimum implied history (Fig. 10) of intermediate stages of Slash, Partially Cleared Slash, and Open-canopy Shrubs.
As mentioned earlier, some of the ambiguities in class names (Table 3) were resolved by using the pixel histories. Some histories, and thus some super classes, are not possible within the context of the area or the time covered by the images. For example, the fractions of the basic endmembers did not distinguish between Sparse Pasture and Partially Cleared Slash. These classes commonly could be resolved, however, by referring to the previous class in a time series. A sparse pasture can be produced by overgrazing, which increases the amount of soil exposed, but slash cannot be produced from pasture without first passing through a stage of shrub growth.
Class histories were used to address specific questions about land use in the study area. For example, the class-change data were used to show: 1) felling of forest and clearing of regrowth that occurred between 1988 and 1991 (Fig. 9a), and 2) where pasture had been overgrown by shrubs and trees during the same interval (Fig. 9b). From Fig. 9 it is evident that at Fazenda Dimona during the time interval studied, more area of pasture was lost to regrowth than was cleared.
Areas of felled forest (red in Fig.
9a) were determined by grouping all pixels that were in the class
Primary Forest in 1988, 1989 or 1990, and changed to Slash, Partially Cleared
Slash, Partially Burned Slash, Pasture, Sparse Pasture or Open-Canopy-Regrowth.
Similarly, pixels of felled regrowth (blue in Fig.
9a) were defined as having been Open-Canopy Regrowth or Closed-Canopy
Regrowth in 1988, 1989 or 1990 and changed to Slash, Partially Cleared Slash,
Partially Burned Slash, Pasture or Sparse Pasture. Areas of regrowth of shrubs
(green in Fig. 9b) were
determined by grouping pixels that were Pasture or Slash in 1988, 1989 or 1990
and changed to Open-Canopy Regrowth or Closed-Canopy Regrowth.
Misclassification also could occur when endmembers were mimicked by other spectra. This type of error could be avoided by knowing in advance what endmembers were spectrally similar. For example, it was apparent at the stage of selecting reference endmembers (see Methods Section) that some soils mimicked some dry grasses. In the case of TM this potential ambiguity cannot be resolved except by context; however, Roberts et al. (1992, 1993) and Sabol et al. (1992b) showed that dry grass and soil could be distinguished in California with high spectral resolution Airborne Visible-Infrared Imaging Spectrometer (AVIRIS) images.
In one case misclassification occurred when a cluster of pixels fit the endmember model, but their field class was not included on the class list, along with their spectral attributes. Field checks revealed that these pixels covered areas where Kudzu vine, that had been planted as a cover crop, mimicked the fractions characteristic of closed-canopy Cecropia forest. Subsequent analysis showed that these areas had a lower shade fraction than Cecropia, and could be correctly classified on that basis.
Mimicking also occurred when field classes, like endmembers, were mixed at the sub-pixel scale. The classes selected for this study were appropriate for the 30-m pixels of TM, for at this spatial scale large groups of pixels corresponded to the field-defined class names, and relatively few pixels were large enough to occupy more than one class. Where pixels overlapped class boundaries in the field, there was no corresponding class name, and the pixels typically were misclassified. As a result, misclassification was more likely to occur at sharp spatial boundaries such as roads and edges of fields. Misclassification at boundaries is a general problem that affects any classification scheme. It is not due to an error in the fractions of the endmembers. If one were to visit the pixel on the ground the proportions of shade, GV, NPV, and soil would be expected to be accurate within the limitations of the model used.
It follows from the above discussion that any increase in pixel size may increase classification error. The effect of increasing pixel size was simulated by adding blocks of pixels, and classifying the resulting images. As expected, classification accuracy relative to the starting image decreased rapidly. At the scale of hundreds of meters many pixels overlapped the spatial boundaries of the classes that were defined in the field; therefore the pixels were misclassified. The evident exception was the class Primary Forest which comprised large enough areas to be classified correctly in most pixels.
System Noise Propagating to Fraction and Class Errors Fraction errors are a complex function of system noise, spectral contrast, spectral sampling, and residuals, and they may propagate into a classification. The magnitude of these errors was assessed using methods developed by Sabol et al. (1992a, b), Smith et al. (1994b) and Lawler and Adams (1994). Based on the uncertainty in the fractions derived from multiple applications of Equation 1, the corresponding error in the classes was calculated, and a confidence level was assigned to each pixel (Sabol et al., 1992a,b). Pixels falling below the 90% confidence level in terms of their numbered category assignment were displayed as an image (not shown) and on the modified tetrahedron of the data cluster ( and 6). The spatial pattern of the pixels below the 90% confidence limit was used to judge whether there were significant areas of the image that were not well classified, or whether poorly classified pixels were associated with systematic or random noise.
Low confidence levels were associated with pixels near category boundaries in the data space (Fig. 6), where relatively small influences on the signal by system noise could cause pixels to move to an adjacent, but incorrect, category. For a given level of system noise this effect was calculated independent of the particular image, and, provided a basis for predicting which classes could be recognized most reliably in the context of the others (Sabol et al., 1992a). For example, the lowest spectral contrast among the four endmembers was between NPV and soil. Therefore, the below-90%-confidence zone was wider for those category boundaries that are based on distinguishing NPV from soil, whereas they were narrower for the boundaries between GV and NPV, or GV and soil. Accuracy near category boundaries was improved by using pixel histories (time-series images) to identify misclassified pixels. Pixels that showed disallowed transitions according to Fig. 10 were re-assigned to the nearest neighboring class.
At any given level of system noise, the ability to distinguish among GV, NPV and soil was influenced by the shade fraction. Increased shade fractions were accompanied by reduced signal levels from other endmembers, eventually to the point where noise exceeded a pre-selected confidence-level threshold for the signal, and classification was no longer possible. The threshold signal (and shade fraction) could be calculated for each pixel by the method of Sabol et al. (1992a) mentioned above. A simple, qualitative display of the effects of shade on classification confidence is shown in Figs. 7 and 9, in which the classification images are modulated by the complemented shade image. Pixels having low shade fractions were distinctly colored, whereas high-shade pixels were dark, and the colors associated with the class assignments were faint or indistinct to the eye. Thus, pixels that were misclassified because of low signal-to-noise also were too dark to identify by color.
Classification Accuracy Classification accuracy traditionally is expressed as the percentage of correctly classified pixels. Assessment of accuracy requires sampling a statistically significant number of pixels, and correctly locating those pixels in the field. However, a single figure for classification accuracy can be misleading if, for example, a large, homogeneous area such as Primary Forest is correctly classified, thereby strongly weighting the total. In this study, no attempt was made to produce a formal measure of the percentage of accurate pixels; however, it is estimated that the figure would be above 90%.
The high estimated accuracy is a consequence of 1) designating a small number of classes that are based on spectrally specific fraction categories; 2) allowing pixels to carry the names of more than one class until context or history information allowed further decision; 3) not forcing pixels with high residuals or high noise to be classified; and 4) flagging and rectifying classification errors by spatial context and by defining forbidden class changes within time-series images.
Shade, Variable Illumination and Topography The subdued topography of the study area minimized differences in illumination due to variable local incidence angles. Variation in sun elevation and azimuth also was minimized, because all images were obtained within the same month (August). These conditions were optimum for comparing classifications in a time series. However, these same conditions were not optimum for testing the more general case of endmember classification of a time series, where illumination conditions vary substantially due to topography, and from image to image. Nonetheless, some useful insights emerged that apply to the general case.
The main effect of varying either the topography or image-wide illumination conditions is to change the shade fraction. In this paper, shade was evaluated in an image context for each of the TM scenes, and the 53%-shade boundary that separated forest from non-forest was valid for all four of the August images. The shade boundary would be different for other zenith angles, and perhaps for other azimuth directions. Dividing the image into >53% shade and <53% shade categories facilitated the subsequent steps, consistent with a typical dichotomous-tree approach. However, it is important to note that >53% shade did not identify a pixel as primary forest, although most pixels of primary forest had >53% shade.
A few pixels of non-forest (for example, pasture or regrowth) had >53% shade, and, therefore, mimicked forest, because they included steep topography, mainly in ravines. (Fortuitously, in the study area primary forest typically was not felled on steep slopes; therefore, few pixels were incorrectly segregated in the first step of the classification procedure). Significantly, pixels of non-forest that were segregated into the high-shade category because of topography, usually could be identified correctly by the other fractions. This was done by selecting sub-categories of shade (e.g. 53-63%), evaluating the normalized fractions of the non-shade endmembers as previously described (Fig. 6), and displaying those pixels in the image context. Results suggested that the confounding effects of variable illumination on classification could be minimized by successively evaluating the (normalized) non-shade fractions in "slices" of the shade fraction (i.e., in sub-categories of shade values), all in an image context.
In all four of the TM scenes a few scattered pixels in the forest were classified as Closed-Canopy Regrowth, because they had low shade (<53%), coupled with high GV and low NPV. Analysis of the time-series confirmed that the same pixels underwent at least one change from Closed-Canopy Regrowth to Primary Forest (a forbidden transition on Fig. 10), thereby indicating a classification error. Closer examination revealed that these pixels occurred on elevated, sun-facing areas of canopy where shadowing was minimal. Once identified they were reclassified as Primary Forest, based on context.
An important refinement of the analysis of the shade fraction would be to discriminate shade produced by macro-topography from shade produced by sub-pixel topography and roughness associated with canopies. The contribution from sub-pixel shading and shadowing can be isolated as a remainder after subtracting the shade fraction derived from a digital-elevation model (macro-topography) from the shade fraction derived from the mixture analysis (Adams et al., 1993). This analysis was not possible for the Amazon study because adequate digital elevation data were not available.
General Significance of Temporal Classification In this study the endmembers GV, NPV, soil and shade, formed the basis for numbered categories, classes and super classes. The endmember spectra selected to model the images comprised a simplistic model of the actual spectral variability, as was mentioned in the Methods Section. Although this simple model ignored some of the details of spectral variability on the ground, it had the advantage of representing common types of materials that comprised ground cover in part of Amazonia. Furthermore, the endmembers comprised a fixed frame of reference for evaluating changes from image to image.
Because the endmembers used in this study represent basic components of many natural vegetated surfaces, the classification scheme presented here may be broadly applicable in Amazonia and elsewhere, if particular caution is given to how class names are applied. Many types of mature forests worldwide are characterized by high shade and moderate NPV, simply as a consequence of the increasing roughness of canopies and the development of woody tissue as trees mature. When forests are felled, there typically follows a predictable adjustment of the fractions of the basic spectral components: shade and GV decrease, while NPV and soil increase. Similarly, regrowth in cleared areas typically is expressed by an increase in GV at the expense of NPV and soil.
These are examples of changes in fractions of endmembers that are associated with processes, but that are relatively insensitive (for the case of a simple endmember model) to the species or communities of vegetation involved. Thus, when the same endmembers and categories used in the Amazon study were applied to TM images of forested areas in the state of Washington, USA, the images were surprisingly well modeled. However, the class names, which were based on local context, could not be exported. For example, in the Manaus region studied, most of the clearing of primary forest has been to establish pasture for cattle, or, locally, other agriculture. Some large areas were cut and allowed to revert to second growth without being used. Commercial logging has been absent or negligible in this area. In contrast, in the northwest Washington TM image studied, the forest clearing was related to commercial logging. Thus, endmember fractions in Category 6 (Fig. 6, Table 3) might be interpreted as the class Pasture in the Manaus image, but as a class "Clearcut" in Washington. Furthermore, temporal changes in the Washington forests would lead to super classes that could have different names from those relevant to Manaus, reflecting the local context. Caution is strongly advised, therefore, when applying class names outside of an area where the context of fraction changes is well understood. These results are beyond the scope of this paper, but suggest further work to test the generality of the approach.
Summary and Conclusions The analytical approach presented in this paper was developed primarily to monitor change in areas where the spectrally dominant materials on the ground are well understood or can be inferred. It was found that a modest initial investment in measuring the spectra of materials on the ground, and / or knowledge of the materials and processes in the area formed a basis for subsequent remote-sensing measurements over time.
A fixed frame of reference for measuring change was established by a simple four-endmember model consisting of green vegetation, non-photosynthetic vegetation, soil and shade. Changes in fractional abundances within an image and from image to image reflected biophysical processes and human influences on land use.
Land-cover types and quantitative changes in land cover were measured by
classifying images based on endmember fractions. Classification was not based
on conventional statistically based techniques or on training areas from each
image, although, training areas were used initially to establish fraction
categories and to link them to class (field) names. Within the limitations of
system noise, general categories of land cover were determined with high
accuracy. Categories typically included more than one class; therefore,
assignment of class names was based on context or pixel history. The spectral
history of each pixel, considered together with the spatial context, provided a
powerful way to monitor change that extended far beyond what was feasible by
ground measurements. The approach described in this paper potentially has broad
applicability for monitoring detailed changes in land cover.
We thank the Instituto Nacional de Pesquisas Espaciais for providing access to TM images, and the Instituto Nacional de Pesquisas na Amazonia and the BDFF project for facilitating field work. G. Ganade, J. Camargo, B. Nelson and B. Forsberg helped in the field and with aircraft observations. S. Willis assisted with programming. J. Mustard and an anonymous reviewer provided helpful comments for improvement of the manuscript. Portions of the work were supported by the Biological Dynamics of Forest Fragments project, the International Atomic Energy Agency, and by NASA. A grant form the W. M. Keck Foundation supported development of the analytical technique and funded computer systems.
Adams, J. B., Smith, M. O., and Johnson, P. E. (1986), Spectral mixture
modeling: A new analysis of rock and soil types at the Viking Lander 1 site,
J. Geophys. Res., 91:B8, 8098-8112.
Adams J. B., Smith M. O., and Gillespie A. R. (1989), Simple models for complex
natural surfaces: A strategy for the hyperspectral era of remote sensing.
Proc. IGARSS 1989, Vancouver, B.C. 1: 16-21.
Adams, J. B., Kapos, V., Smith, M. O., Almeida Filho, R., Gillespie, A. R., and
Roberts, D. A. (1990), A new Landsat view of land use in Amazonia, Int.
Archives of Photogram. and Remote Sens. 28: 177-185.
Adams, J. B., Smith, M. O., and Gillespie, A. R. (1993a), Imaging spectroscopy:
Interpretation based on spectral mixture analysis, In Pieters C. M. and
Englert P., eds., Remote Geochemical Analysis: Elemental and
Mineralogical Composition 7: 145-166, Cambridge Univ. Press, New York.
Adams, J. B. (1993b), A combined atmospheric and systems calibration from
spectral mixture analysis, in Proc. Workshop on Atmospheric Correction of
Landsat Imagery, (P. N. Slater and L. D. Mendenhall Eds.), Geodynamics
Corp., Torrance, CA., 177-180.
Batista, G. T., Shimabukuro, Y. E., Lawrence, W. T., and Antunes, M. A. H.
(1993), El Nino effect on Amazon vegetation cover through NOAA-AVHRR, VI
Sociedad de Especialistas Latino Americanos en Percepcion Remota (SELPER)
Symp., Cartagena, October.
Bierregaard, R. O. Jr., Lovejoy, T. E., Kapos, V., dos Santos, A. A.,
and Hutchings, R. W. (1992), The biological dynamics of tropical rain forest
fragments, Bioscience 42: 859-866.
Buja, A., Hurley, C., and McDonald, J. A. (1987), A "Data Viewer" for
multivariate data, Computer Science and Statistics: Proc. 18th Symp. on the
Interface, ASA, Washington, D.C. 171-174.
Buja, A., McDonald, J. A., and Michalak, J. (1991), Interactive data
visualization using focusing and linking, In G. M. Nielson and L.
Rosenblum, eds., Proc. Second IEEE Conf. on Visualization, San Diego,
IEEE Computer Soc. Press.
Fearnside, P. M. (1993), Deforestation in Brazilian Amazonia: The effect of
population and land tenure, Ambio 22: 537-545.
Gillespie, A.R., Smith, M.O., Adams, J.B., Willis, S.C., Fischer, A.F. III, and
Sabol, D.E. (1990), Interpretation of residual images: Spectral mixture
analysis of AVIRIS images, Owens Valley, California, Proc. 2nd Airborne
Visible/Infrared Imaging Spectrometer (AVIRIS) Workshop, JPL Pub. 90-54:
243-270.
Golub, G. H. and Van Loan, C. F. (1989), Matrix Computations, Johns Hopkins
University Press, Baltimore MD.
Hall, F. G., Botkin, D. B., Strebel, D. E., Woods, K. D., and Goetz, S. J.
(1991), Large-scale patterns of forest succession as determined by remote
sensing, Ecology 72: 628-640.
Horowitz, H. M., Nalepka, R. F., Hyde, P. D., and Morganstern, J. P.
(1971), Estimating the proportions of objects within a single resolution
element of a Multispectral Scanner. University of Michigan, Ann Arbor, NASA
Contract NAS-9-9784.
INPE (Instituto Nacional de Pesquisas Espaciais) (1992), Deforestation in
Brazilian Amazonia, INPE, Sao Jose dos Campos, Brazil.
Lawler, M. and Adams, J. B. (1994). Characterizing image errors using the
spectral mixture framework, Lunar and Planetary Sci. XXV: 779-780.
Lovejoy, T. E. and Bierregaard, R. O. Jr. (1990). Central Amazonian forests and
the Minimum Critical Size of Ecosystems Project, in A. Gentry, ed.,
Four Neotropical Rain Forests; 60-74, Yale Uiversity Press, New Haven,
CT.
Lucas, R. M., Honzak, M., Foody, G. M., Curran, P. J., and Corves, C. (1993),
Characterizing tropical secondary forests using multi-temporal Landsat sensor
imagery, Int. J. Remote Sens. 14: 3016-3067.
Nelson, B. W. (1994) Natural forest disturbance and change in the Brazilian
Amazon, Remote Sens. Rev. 10: 105-125.
Nelson, B. W., Kapos, V., Adams, J. B., Oliveira, W. J., Braun, O. P. G., and
do Amaral, I. L. (1994), Forest disturbance by large blowdowns in the Brazilian
Amazon, Ecology 75: 853-858.
Roberts, D. A., Adams, J. B., and Smith, M. O. (1990), Predicted distribution
of visible and near-infrared radiant flux above and below a transmittant leaf,
Remote Sens. Environ. 34: 1-17.
Roberts D. A., Smith M. O., Sabol D. E., Adams J. B., and Ustin S. L. (1992),
Mapping the spectral variability in photosynthetic and non-photosynthetic
vegetation, soils, and shade using AVIRIS, Proc. Third Annual Airborne
Geosci. (AVIRIS) Workshop, JPL Pub. 92-14, 1: 38-40.
Roberts D. A., Smith M. O., and Adams J. B. (1993), Green vegetation,
non-photosynthetic vegetation and soils in AVIRIS data, Remote Sens.
Environ. 44: 255-269.
Sabol D. E., Adams J. B., and Smith M. O. (1992a), Quantitative sub-pixel
spectral detection of targets in multispectral images, J. Geophys. Res.
97: 2659-2672.
Sabol D. E., Roberts D. A, Smith M. O., and Adams J. B. (1992b), Temporal
variation in spectral detection thresholds of substrate and vegetation in
AVIRIS images, Proc. Third Annual Airborne Geosci. (AVIRIS) Workshop, JPL
Pub. 92-14, 1: 132-134.
Shimabukuro, Y. E., Holben, B. N., and Tucker, C. J. (1994), Fraction images
derived from NOAA AVHRR data for studying the deforestation in the Brazilian
Amazon, Int. J. Remote Sens. 15: 517-520.
Skole D. and Tucker, C. (1993), Tropical deforestation and habitat
fragmentation in the Amazon: Satellite data from 1978 to 1988, Science
260: 1905-1910.
Smith, M. O., Ustin, S. L., Adams, J. B., and Gillespie, A. R. (1990a),
Vegetation in deserts: I A regional measure of abundance from multispectral
Images, Remote Sens. Environ. 31:1-26.
Smith, M. O., Ustin, S. L. Adams, J. R., and Gillespie, A. R. (1990b),
Vegetation in deserts: II Environmental influences on regional abundance,
Remote Sens. Environ. 31:27-52.
Smith, M. O., Adams, J. B., and Sabol, D. E. (1994a), Spectral mixture
analysis: New strategies for the analysis of multispectral data, in
J. Hill and J. Megier, eds, Imaging Spectrometry - A tool for Environmental
Observations, Euro Courses, Remote Sensing, Vol. 4: 125-143. Kluwer
Academic Publishers.
Smith, M. O., Roberts, D., Hill, J., Mehl, W., Hosgood, B., Verdebout, J.,
Schmuck, G., Koechler, C., and Adams, J. (1994b), A new approach to determining spectral abundances of
mixtures in multispectral images, Proc. IGARSS 1994), Pasadena, CA.
Table 1. Combined gains
and offsets to convert encoded radiance (DN) to reflectance in each of the four
TM images. The 1989 image was calibrated to reflectance by empirical-line and
mixture-model methods (see text); the other three images were inter calibrated
to the 1989 image. For each band: Reflectance = (DN-offset) / gain.
Table 2. Interpretive Color Key for Multi-Temporal Fraction Images
Table 3. Fraction Categories and Class NamesFIGURE CAPTIONS
Return to Publications.
Return to the home page.
Last Modified 15 October 1998
webmaster@rad.geology.washington.edu